Market Update
The Good The Bad And The Ugly The market decline that started a few weeks ago ended this past week. The decline retraced only about 33% of the previous uptrend. Momentum has turned positive.
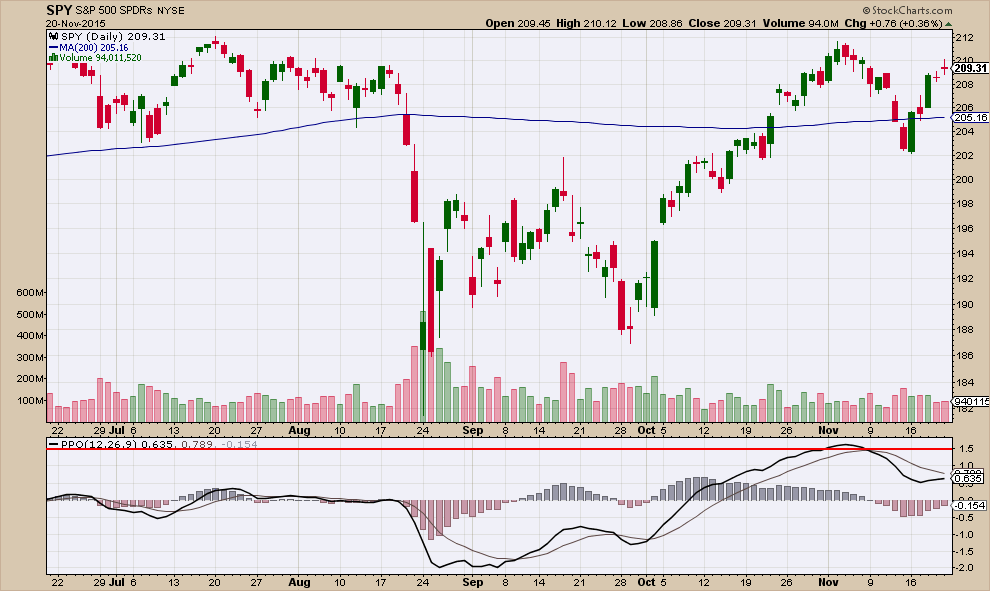
While I believe that short term the market is suggesting it wants to go higher, long term this market looks extremely vulnerable to a more severe correction. You could categorize stock market conditions as good, bad and ugly.
The Good: Short-Term Stock Market Strength/Momentum
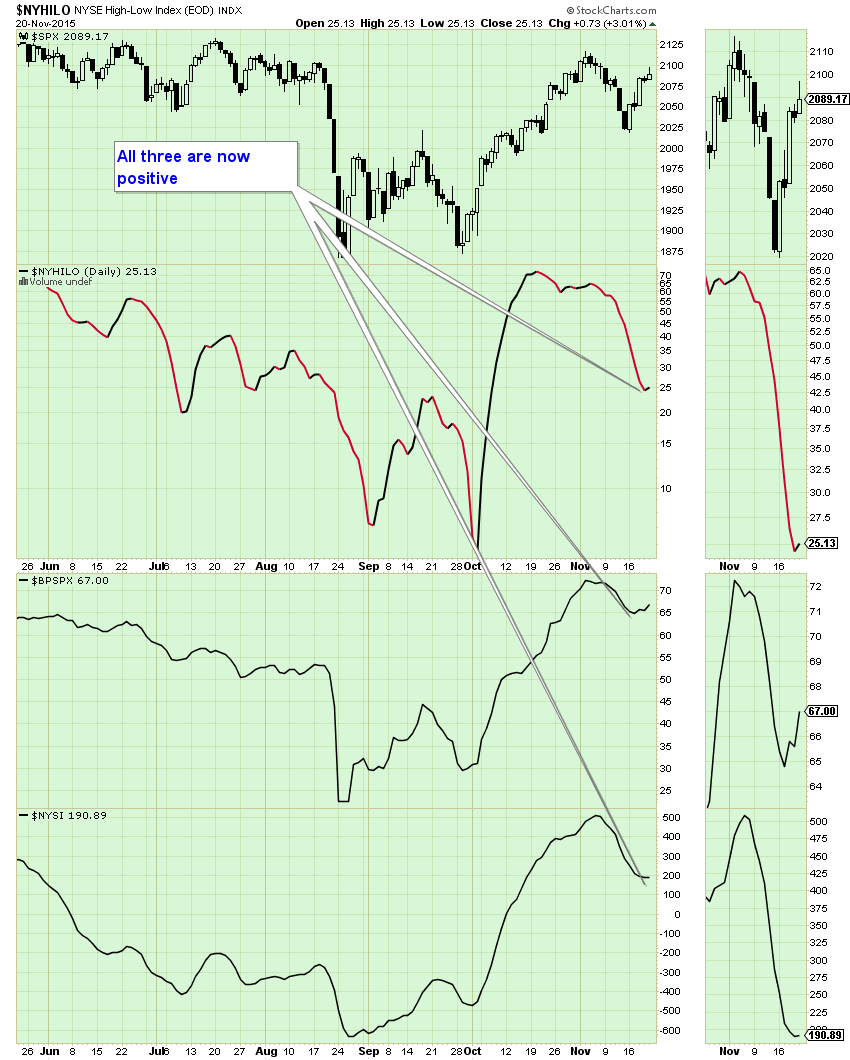
The breadth and VIX indicators that I have shown the past couple of weeks all turned positive. This suggests that odds favor stocks going higher “in the short-term”. Below are those breadth indicators and they all turned up last week.
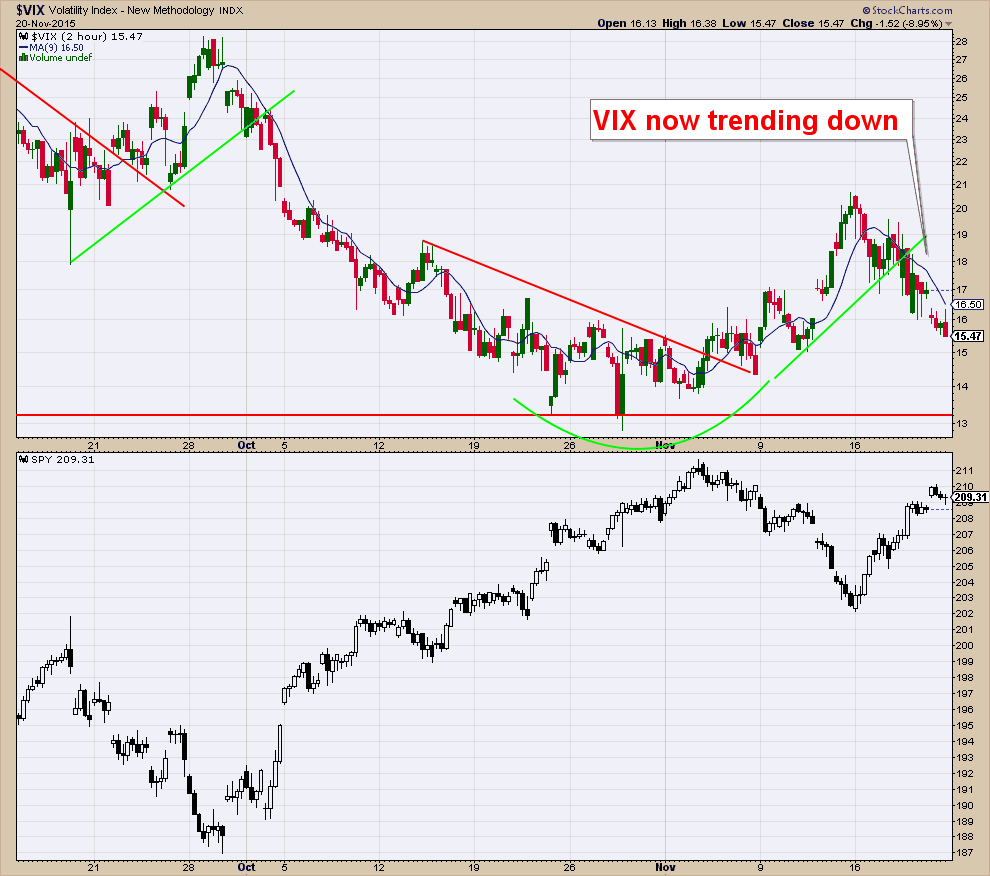
One of the main charts that I follow to determine market bottoms and tops is the VIX (Volatility Index). The VIX is a contrarian sentiment indicator that helps to determine when there is too much optimism or fear in the market. When sentiment reaches one extreme or the other, the market typically reverses course.
Below you will see the VIX chart shown above a chart of SPY. Market tops usually occur during low VIX readings, when investors are complacent, and bottoms usually occur during high VIX readings.
Last week I mentioned that the VIX was trending up and that a change in that trend would be a signal that the stock market correction was over.
Below is the 2-hour chart of the VIX that I showed last week. You will notice that it fell below its uptrend line and its 11-day moving average. The VIX is now trending down which suggests higher stock prices over the near term.
The Bad: A Thinning Domestic Stock Market
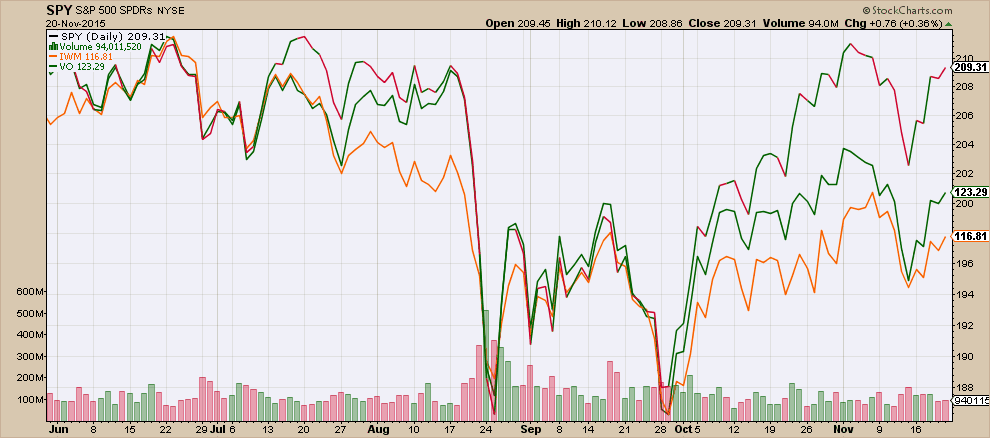
The S&P 500 index has rallied to get back to even for the year, however this does not tell the whole story. This is a very thin market. Meaning the majority of stocks are doing much worse than the index. Below is a chart showing a Small Cap ETF (orange line) and a Mid Cap ETF (green line) along with the S&P 500. As you can see both are doing much worse than the index.
Many sectors are also doing much worse than the index. Below is the S&P 500 along with a Biotech ETF (orange) and a Retail ETF (green).

The Ugly: Slowing Economic Growth
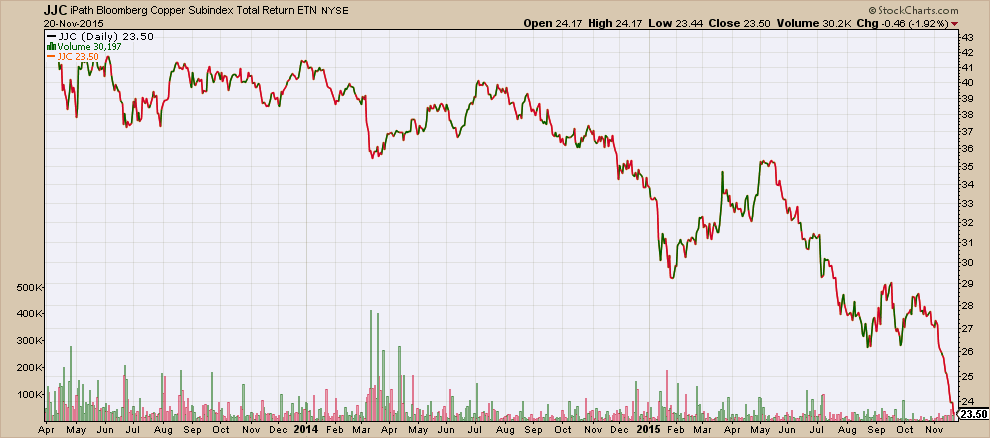
We continue to see industrial economic barometers like Copper and Crude Oil falling and a stronger dollar does not explain this away.
Below is a chart of Copper.
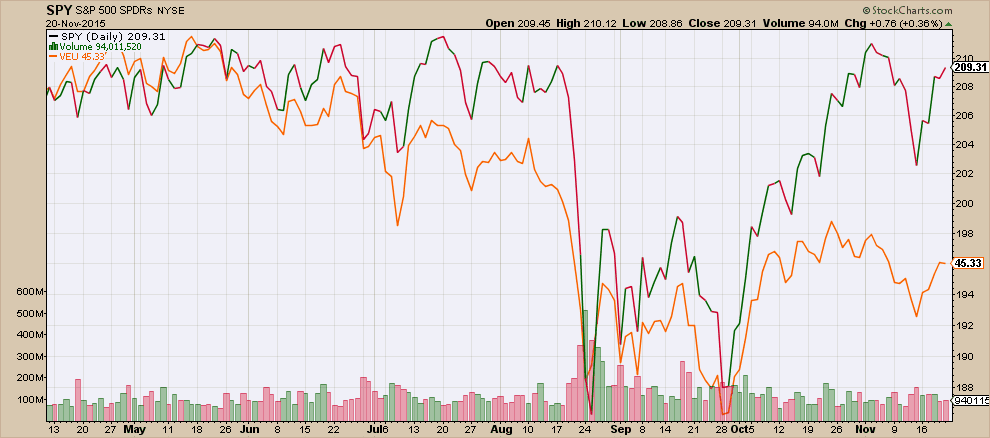
Most international stock markets are falling. Below is a chart of the S&P 500 along with a diversified International ETF (orange line).
In summary, we have a stock market that is now showing strengthening momentum over the short term. However, we have a stagnant domestic economy, thinning stock market, and slowing economic growth. I believe that while stocks may be poised to advance in the near term, long term the odds are high that we could see them fall substantially.
Client Update
I moved back into stocks and bonds last week. Currently our aggressive accounts are about 60% allocated in stock funds and our conservative clients are at 30% stocks and 15% bonds. I will be looking to allocate our remaining cash strategically.
While I believe that the odds are good that stocks are poised to go up in the short term. Long term things don’t look as positive. Because of this I will be looking to move back to cash if my market indicators suggest this up-move in stocks is over.
Craig Thompson, ChFC
